
A page that takes a long time to display can have several causes: Jint components, SharePoint, your network or your workstation. To find the cause quickly, we need precise information, collected while the slowness is happening.
This article describes the checks to run before contacting us, the questions to answer and the technical files to send us.
📋 Table of contents
- 1. Quick checks before contacting us
- 2. Describe the slowness
- 3. Compare with and without Jint components
- 4. Record the technical files
- 5. Send us the files
1. Quick checks before contacting us
1.1 Check ongoing incidents
Go to the Ongoing incidents section of the Help Center. If a slowness incident is displayed there, there is no need to open a ticket: the article is updated as the analysis progresses.
Your administrator can also check the status of SharePoint services on the Service health page of the Microsoft 365 admin center.
1.2 Test on another browser or computer
Open the same page:
- in a private window (InPrivate in Edge, Incognito in Chrome);
- in another browser;
- on another computer, or with another user.
💡 If the slowness disappears in a private window, a browser extension or the cache may be the cause.
1.3 Test on another connection
If you go through a VPN or a proxy, test the same page from another connection, for example a 4G connection shared from a phone, if your internal policy allows it. If the page displays much faster, the network becomes the priority lead.
1.4 Check your tenant configuration (administrator)
⚠ These checks must be carried out by your SharePoint administrator and, for the network, by your network administrator.
Jint domains allowed on your network
If your organization uses a VPN, a firewall or a proxy, check that the following addresses are allowed.
Addresses:
- cdn-jint.azureedge.net
- authentication-api-jint.azurewebsites.net
- clientsettings-api-jint.azurewebsites.net
- newshub-api-jint.azurewebsites.net
- jint.io
Subdomains:
- cdn.jint.io
- config.jint.io
- translator.jint.io
- contribcent.jint.io
- newshub.jint.io
- api.jint.io
- clisettings.jint.io
Trusted script sources
- Go to the SharePoint admin center.
- In the Advanced tab, click Script sources.
- Check that the following addresses are present:
- https://sp-cdn.jint.io
- https://cdn.jint.io
⚠ Also check that none of the addresses in the list contains a typo. A single missing character, such as a trailing "/", is enough to cause loading errors.
Third-party tools installed on your tenant
Audience measurement or monitoring tools (for example Matomo, Dynatrace or Microsoft Clarity) can generate security errors that slow down the display. Ask your IT team to check their configuration.
2. Describe the slowness
Answer the questions below in your ticket. The more precise the description, the faster the analysis.
2.1 When does the slowness happen?
- Since when (date and time)?
- Did anything change just before: a Jint update, a migration, a change to your network or security, a new tool installed?
- Is the slowness permanent or occasional? Does it happen at certain times of the day?
- Does it happen only the first time the page loads, or also on later loads?
- Roughly how many seconds does the page take to display?
2.2 Where, and while doing what?
- What are the addresses (URLs) of the affected pages? Are all pages affected, or only some?
- Does the slowness happen when simply viewing the page, in edit mode, or in both cases?
- What action was in progress: displaying the page, opening the component catalog, creating or publishing news, adding images, searching, using a menu…?
- Which components does the page contain: only SharePoint components, only Jint components, or both?
- Is an error message displayed? If so, take a screenshot. On a SharePoint error page, also note the Correlation ID.
2.3 On which computer and connection?
- Which browser, and which version?
- Which extensions are installed on this browser?
- Do you work on a physical computer or on a virtual desktop (VDI, Citrix…)?
- Where are you connected from: the office, home, on the move? Do you notice a difference depending on the location?
- Do you go through a VPN, a proxy or a filtering tool?
2.4 Who is affected?
- All users, or only some? Roughly how many?
- Which roles: visitors, members or contributors, owners or administrators?
- In which countries or on which sites are the affected users?
3. Compare with and without Jint components
This test shows whether the slowness comes from Jint components. Compare the display time of:
- the page as it is;
- the same page, adding
?disable3PCode=1at the end of its address. If the address already contains a "?", add&disable3PCode=1instead. This SharePoint parameter temporarily disables third-party components, including Jint's, for your own view only; - a SharePoint page without any Jint component, on the same site.
📎 Example: https://<your-tenant>.sharepoint.com/sites/intranet/SitePages/Home.aspx?disable3PCode=1
Tell us the result in your ticket: is the page still slow without the Jint components?
💡 This test does not change anything on your site. To go back to the normal display, simply remove the parameter from the address.
4. Record the technical files
⚠ The slowness must happen during the recording. Otherwise, the files cannot be analyzed. The video, the network trace and the console must come from the same session, on the same page. Note the time of the recording.
4.1 Video of the slowness
- Record your screen while the slowness is happening.
- Keep the address bar visible, so that we know which page it is.
- If possible, keep the Network tab of the developer tools open during the recording.
4.2 Network trace (HAR file)
📌 For more details, see the article Procedure for retrieving network traces and the console for ticket analysis.
- Open a new browser window and go to the affected page.
- Open the developer tools (F12, or right-click then Inspect).
- Select the Network tab.
- Check Preserve log and Disable cache.
- Reload the page (F5), then reproduce the slow action. Wait until loading is fully complete.
- Right-click in the list of requests, then click Save all as HAR with content.
We need two HAR files:
- HAR 1: during the slowness;
-
HAR 2, as a reference: the same page, on the same computer, when it displays normally. If the slowness is permanent, record this second file on the page with the
?disable3PCode=1parameter (see part 3).
💡 Give your files explicit names, for example home-slow.har and home-normal.har.
4.3 Console
- Once the network trace is recorded, click the Console tab.
- Right-click in the messages area, then click Save as.
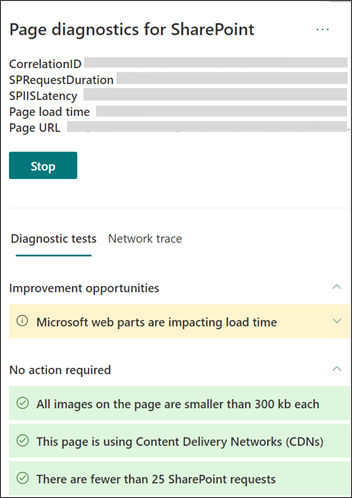
4.4 Page Diagnostics for SharePoint report (optional)
Microsoft offers a browser extension, Page Diagnostics for SharePoint, that analyzes a page and lists what slows down its display.
- Install the extension by following the Microsoft documentation.
- Open the affected page, then launch the tool.
- Export the results and attach them to your ticket.
5. Send us the files
Before sending your request, check that you have:
- your answers to the questions in part 2;
- the results of the tests in parts 1 and 3;
- the video of the slowness;
- the HAR file recorded during the slowness and the reference HAR file;
- the console export;
- screenshots of any error messages;
- the Page Diagnostics for SharePoint report, if you ran it.
Attach these files to your existing ticket, or create a request from the Jint Support form.
⚠ HAR files can weigh several dozen MB and exceed the allowed attachment size. In that case, say so in your ticket: Support will send you an invitation to a OneDrive space where you can upload your files.
Comments
0 comments
Please sign in to leave a comment.